
So tomorrow is, probably, the last day of wakeboarding at Hove Lagoon this year, which makes it the end of the first proper season for the little PWA I wrote about in August. That post finished with three open questions: would anyone actually book through the app now that they could, were the push notification subscribers the same three people or was it spreading, and could I please get the analytics into something I could actually look at. It seemed only right to go and answer them before the cable gets switched off, so this morning I ran the Athena queries and then, because it’s Halloween and the app is currently purple with spiders dangling off the header, turned the answers into something I could share with the WhatsApp group.
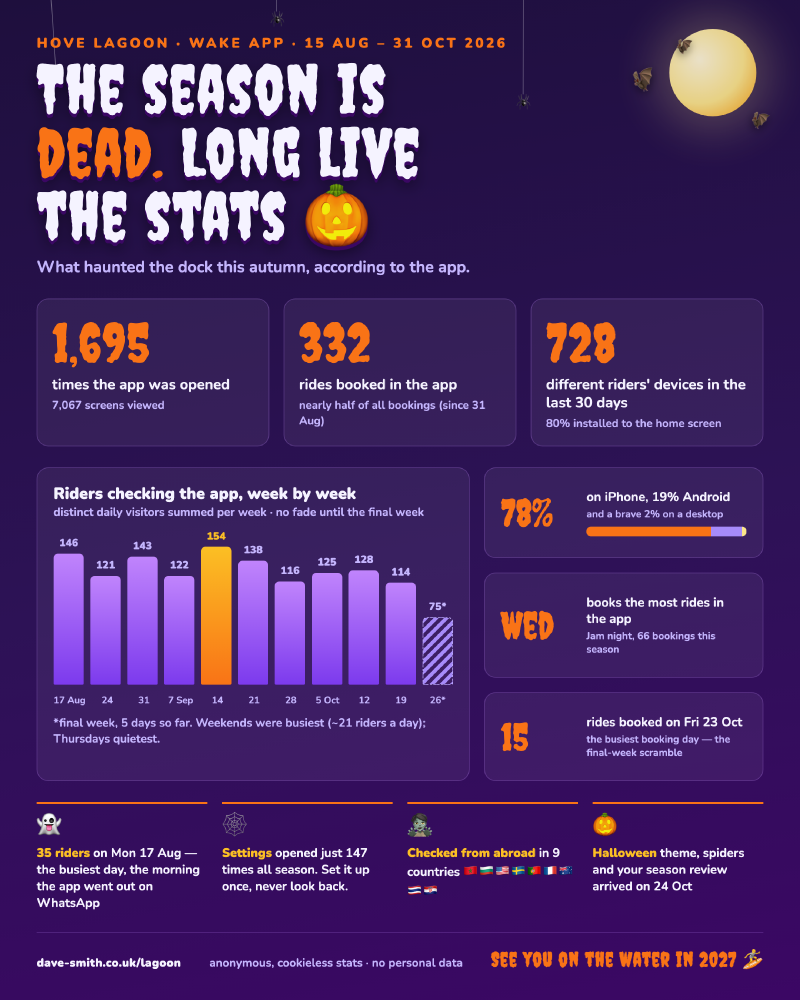
There’s a live version of that card too, because a static image doesn’t do justice to spiders swinging on their threads.
A quick word on what those numbers are before anyone takes them too seriously. The analytics are cookieless by construction, so the visitor identifier is a hash that re-rolls every day. That means “visitors” is really visitor-days rather than people: me opening the app on Monday and again on Tuesday counts twice. The “728 different devices in 30 days” figure comes from the CloudFront logs instead, which is distinct IP addresses, and mobile IPs churn enough that it’s an approximation at best. Neither of those is a reason not to look at the numbers, but it’s a reason to look at the shape of them rather than the last digit.
The shape is the interesting bit. From the WhatsApp launch in mid August through to the third week of October, the number of people checking the app each week sat between about 115 and 155 and basically didn’t move. No growth, but no fade either, right through a period where the weather was getting steadily worse and you’d expect a wakeboarding app to be quietly dying. Weekends were busiest at around 21 people a day, Thursdays were quietest, and the only dip is the final week, which is tomorrow’s problem. For a tool shared with one WhatsApp group of members at one lagoon, a flat line of a couple of hundred sessions a week is a very respectable flat line.
The booking question got the answer I was hoping for, eventually. Since the start of September, 332 rides have been booked in the app against 357 through the old “Book on the website” link, so very nearly half of all bookings now go through the sheet I was so nervous about in August. Wednesdays are the biggest in-app booking day, which is the Jam night and exactly when you’d want to grab a spot from your phone rather than a laptop. The busiest single booking day was Friday the 23rd of October with fifteen rides booked, which is the final-week scramble, everyone realising at once that there were eight days left.
I say “eventually” because for the first two weeks after launch the answer appeared to be zero, which was dispiriting right up until it turned out to be a bug in my own analytics. The ingest Lambda has a server-side allowlist of event names so that random junk can’t be posted into the S3 bucket, and when I added the inapp_book event to the app I didn’t add it to the allowlist, so every in-app booking was being faithfully beaconed and then silently dropped on arrival. People had been booking happily the whole time. I just couldn’t see them. The two weeks of history are gone for good because the events were never stored, which is the privacy design working exactly as intended against me, but it does mean the 332 is an undercount.
The push notification question has a less dramatic answer: fourteen subscribers, steady since August, so not the same three people but not exactly viral either. Seven people enabled notifications over the whole season, nobody disabled them, and the Settings screen was opened just 147 times in 77 days. People set it up once and never look at it again, which I’m choosing to read as a compliment. Eighty percent of sessions come from the installed home-screen app rather than a browser tab, which was the whole point of making it a PWA, and the platform split is 78 percent iPhone, 19 percent Android and a brave 2 percent on a desktop. A dozen or so sessions came from nine other countries, which I like to think is riders on holiday checking whether it’s worth coming home early.
The app didn’t stand still over the season either. Group booking went live at the start of September so you can book yourself and your kids in one go, which is the reason I wanted in-app booking in the first place. The History tab got an all-time best streak alongside the live one. A conversation on the dock in October, with someone who had no idea you could add a booking to your calendar from the Bookings list, turned into a confirmation card that pops up after you book with an “Add to calendar” button right there, which is the kind of feature you only find out you need by standing next to your users. There’s an end-of-season review that pops up once, a little stats carousel of your own rides, hours on the water, streaks and who you rode with most, which went live on the 24th of October alongside the Halloween theme. And there’s a Christmas theme sitting in the code already, snow drifting across the header from the 1st of December, because nobody is going to update a wakeboarding app once the lagoon is shut, so anything I want people to see in December had to ship in October.
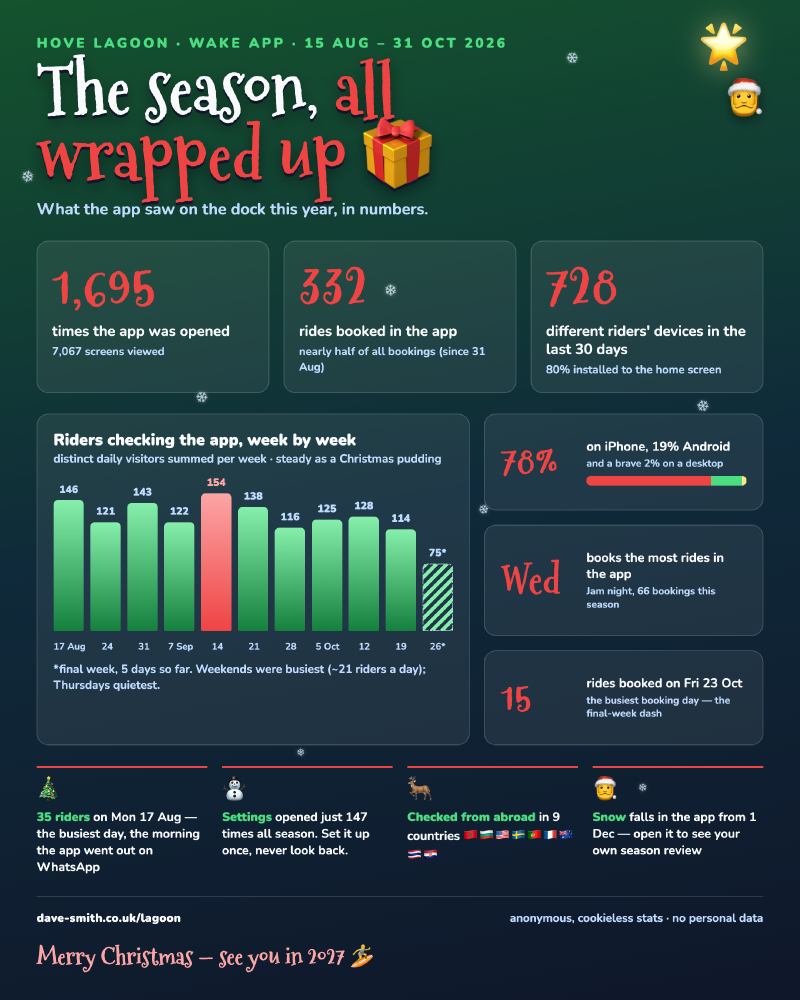
And since the Christmas theme was already sitting in the code waiting for December, it seemed rude not to give the stats the same treatment. Same numbers, snow instead of spiders, and I’ll admit “steady as a Christmas pudding” is a better description of that bar chart than anything I’d written in the queries. Live version with falling snow here.
The one outage of the season wasn’t mine, which is a first. Open-Meteo, the weather API, started returning “the service is overloaded” intermittently in mid October and the app responded by dropping the weather line from every day, which looked exactly like a bug I’d shipped. It wasn’t, but it was still my problem, so the app now falls back to the last forecast it cached if the live one fails and it’s less than twelve hours old. Weather is a nice-to-have on the availability screen and it should degrade like one.
All of this was built the same way as before, with Claude Code, one pull request at a time with the tests gating the merge, and the analytics queries this morning were the first time the whole loop closed: build a thing, ship it to a few hundred people, measure what they did with it, and then make a Halloween poster about it. The app goes quiet now until the water warms up again, the Christmas theme will arrive on the 1st of December for the handful of people who open it to look at their history, and assuming the booking API is still where I left it in the spring, the next season starts with a flat line of a couple of hundred sessions a week already waiting for it.
See you on the water in 2027. I should probably go and have a last ride tomorrow rather than running more queries about it.